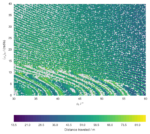
This is research I conducted at Duke University to determine the sensitivity of final field position to punts’ initial conditions in American football. Here’s a sample figure from the paper:
Publications & Presentations
Turner, J. D. and B. P. Mann. “Sensitivity of Final Field Position to the Punt Initial Conditions in American Football”. Proceedings of the ASME 2016 International Design Engineering Technical Conferences & Computers and Information in Engineering Conference. Charlotte, NC, August 2016. (conference paper (PDF) and presentation (PDF))
Abstract
This is the abstract from the conference paper:
The starting field position is often a deciding factor in an American football game. In the case of a defensive stop, a kick, known as a punt, is used to give the receiving team a field position that is more advantageous to the kicking team when possession changes. The goal of the punter is to kick the ball along a desired flight path, where a delicate balance between the distance traveled before impact, hang time in the air, and the distance traveled after bouncing is favorable for the kicking team. However, the punter has only imprecise control over the initial conditions, such as the angular velocity, linear velocity, and orientation of the football. Due to the highly nonlinear behavior of the football, from aerodynamic and impact forces, even small changes in initial conditions can produce large changes in the final position of the football, but there may be regions of initial conditions with relatively consistent results. If punters could target such large contiguous regions of initial conditions with desirable football paths, they could improve their chances of successful kicks.
For nonlinear systems, basins of attraction diagrams are often used to graphically display the initial conditions that lead to different final attractors. In this case, the regions of initial conditions that lead to a desirable final field position can be grouped and shown graphically. A numerical simulation program was developed including models for aerodynamic flight and bouncing of the irregularly shaped football. The flight model used fourth order Runge–Kutta integration of the equations of motion of the football, including gravitational and aerodynamic forces and moments with empirical lift, drag, and yaw coefficients in three dimensions. The bounce model was based on an empirical two-dimensional coefficient of restitution model that was published in the literature. The behavior of a football in flight and during bouncing was simulated for a range of initial angular velocities and launch angles, and the characteristics of the flight paths were analyzed. The characteristics of some regions of initial conditions were relatively sensitive to small changes, while other regions were relatively uniform. This shows that this approach, with a quantitatively accurate bounce model, could be practically applied to develop a guide for punters to optimize their kicks. With such a guide and sufficient practice, punters could select and target the larger regions of initial conditions that produced desirable behavior, which would improve their chances of successful punts.
Written by James D. Turner and Brian P. Mann, currently © 2016 ASME, and licensed under CC BY‑NC‑ND 4.0.