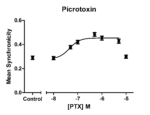
This was research I conducted at the U.S. Environmental Protection Agency in 2010–11. My primary goal was to develop a method (and software) to quantify the changes in synchronicity of action potentials in neuronal networks in response to exposure to toxicants. This information was then used in a principal components analysis (PCA) to group chemicals by class. This is a sample illustration of the concentration–response curve for synchronicity with picrotoxin:
Publication
Mack, C. M., B. J. Lin, J. D. Turner, A. F. Johnstone, L. D. Burgoon, and T. J. Shafer. “Burst and principal components analyses of MEA data for 16 chemicals describe at least three effects classes”. NeuroToxicology, 40 (Jan. 2014), pp. 75–85. (publisher webpage)